9/28/2012. Even while numbers taking the GRE are up. NYT story here. Interim Provost Bean’s academic plan calls for increasing UO’s graduate students from 15% to 19% of enrollment. Since percentage calculations can be problematic for our interim provost, we got these from a Dog:

Here are some old numbers from a post last year:
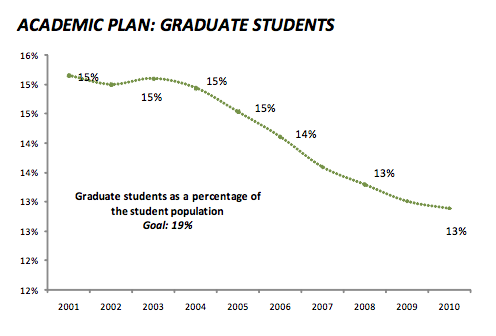 |
9/24/2011: This graph from UO’s latest report to OUS on our “academic plan” certainly raises the question. See this earlier post for background.
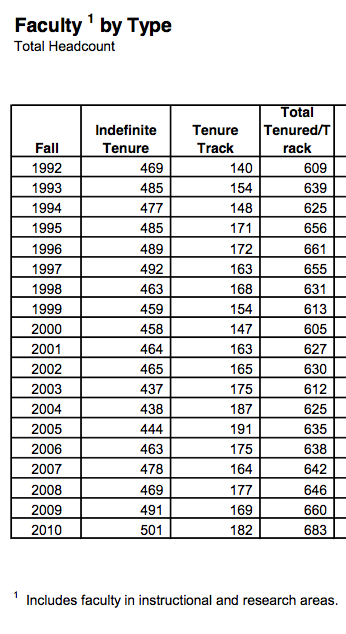
Since 2001 undergraduate enrollment has increased 36%, graduate enrollment by less than 10%, and the number of tenure track faculty by less than 10%. |
 |
Here’s the data on the number of tenure track faculty– pretty flat with a recent small uptick. Here’s the data on enrollment. We have 24,300 this year.
To the left is the number of students (fall enrollments) per tenure track faculty. For 2011, it will be ~35. |
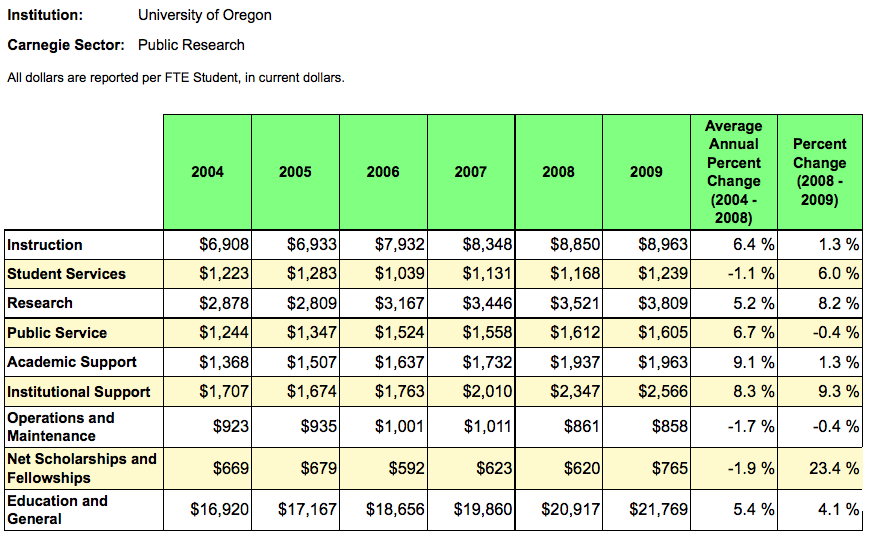
And here’s the latest IPEDS data on where the money is going, from the Delta Project. 2009 means the 2009-2010 academic year, President Lariviere’s first year in charge. 1.3% increase in instructional spending and a 9.3% increase on institutional support – meaning central administrative costs, aka Johnson Hall.
dog says
what’s up with the Y-axis on the first graph?
the tick marks are repeated (i.e. two 14%, two 13%, etc) –> is this another marketing graph?
Why is it so hard for people to make a decent graph? Pro tip #1: If you want tick marks every 0.5 units, don’t eliminate digits after the decimal point. Otherwise you get, for example, “14, 14” for “14.0, 14.5”. Pro tip #2: Unless your readers are idiots, you don’t need to also write the values by each data point. That’s what the axes are for.
Anyway, thanks for the data — this is important! For the last one, it’s interesting to think about the fraction of the total increase that each row takes up.
I guess percentages ARE hard. I don’t see where that top graph comes from. The ENR file from IR shows the 2001 grad population at 3397, with total student population at 19,008. That’s 17.9%.
It shows 2010 at 3547/23389, or 14.4%.
That’s a 4.4% increase in grad student head count. If we had kept the undergrad and nonmatriculated student counts steady, we would have had 18.8% grad students in 2010.
It sure is hard to raise the grad student population when you don’t provide extra funding for teaching GTF positions, don’t hire enough faculty to add substantial new research GTF funding, and you admit thousands of additional undergrads.
I have an idea! Let’s implement a massive increase in tuition and fees for MBA students! That will have them breaking down the doors in record numbers.
Now that there’s a new top graph, I need to clarify that the graph the above comment refers to is the “Academic Plan: Graduate students” graph.
Brilliant! And we’ll call it a Mercedes! But wait, are MBA students really grad students?
MBA = masters of business administration. Isn’t a masters degree a graduate degree?
I would expect grad students to get sarcasm.
Goodbye AAU. Thanks for that, Jim.
Thanks for the updated graph, Dog. Man, that downward slope, when compared with the Academic Plan goal, is not going to look good on the performance review of the person responsible for implementing the Plan.
They do have periodic performance reviews for all administrators, as mandated by UO policy, right?
Dog says
I think we need to be a bit more fair here.
UO dropped below the magic 20% threshold for a Carnegie I Research
University (that classification system no longer exists) around the year 2000/2001 under Linton. Linton of course did squat
to try and expand our graduate programs. Indeed the only reason
that we were every above 20% was due to the Law school for the most part.
So you take the Linton approach – everything is sunshine and rainbows so let’s keep the number of grad students essentially constant. Now combine that with the Bean Sprout idea of having
shitloads of undergrads admitted (while keeping the grad population essentially fixed at 3200 +/- 100 students) then
the percentage decays down to its 2011 level of 14.8% and the
fall 2012 percentage will likely be around 14%.
We have neglected our graduate school programs for about 15 years
now and its likely no one in JH has ever been aware of the trend
shown in the graph. They were aware then they clearly don’t care. I don’t know which is the case.
Wasn’t the massive influx of undergrads justifiable on the grounds that it saved jobs, staved off faculty furloughs and pay cuts, and prevented entire departments from being closed? That’s what happened in some other research universities during the Great Recession, and I think people around here sometimes forget that fact.
Now that we have (hopefully) reached a steady state, with undergrad enrollments plateauing, we do have to think hard about out graduate programs. The problem there is that grad programs are expensive, and ultimately subsidized by undergraduate tuition, at least outside the sciences (and maybe there too). Add to that the fact that in many fields — from humanities to law — the job market for those with graduate degrees is in catastrophic decline, so it is downright unethical to expand graduate enrollments in large swaths of the university.
One answer, it seems to me, might involve shifting toward master’s programs oriented toward marketable interdisciplinary skill sets, combined with much more thoughtful training and mentoring of GTFs to help service all those new undergraduates. In the process this would give those same GTFs/MA candidates one major marketable skill (the ability to teach a group of people) when they get out of here.
Increasing the emphasis on master’s degree programs is one possible strategic response to the decline in the number of graduate students at UO. Indeed, the graduate school seems to be pushing this agenda. However, I would offer the following cautions:
(1) master’s students require a significant commitment in terms of curriculum development. Of course, master’s students can just be added to mix in large sections of 400/500 level courses. This doesn’t seem ideal from an ethical perspective.
(2) Teaching large numbers of master’s students implies a significant amount of grading for faculty. Generally, the UO graduate school has not approved of using PhD level graduate students to grade students in master degree programs.
(3) Successful master’s degree programs often have a dedicated staff person who supports advising, recruiting activities, and job placement services. This is expensive and implies a fairly large scale of operations.
(4) Master’s degree students are typically not very helpful as research assistants. Generally, the presence of a large master’s degree program will not serve as an inducement when recruiting new faculty.
(5) The academic ranking of individual departments will not be improved by successful master’s level programs.
It would be interesting to break out the data on graduate students into two categories: PhD students and all others. I’m guessing the decline of doctoral programs at UO is more significant than then overall decline.