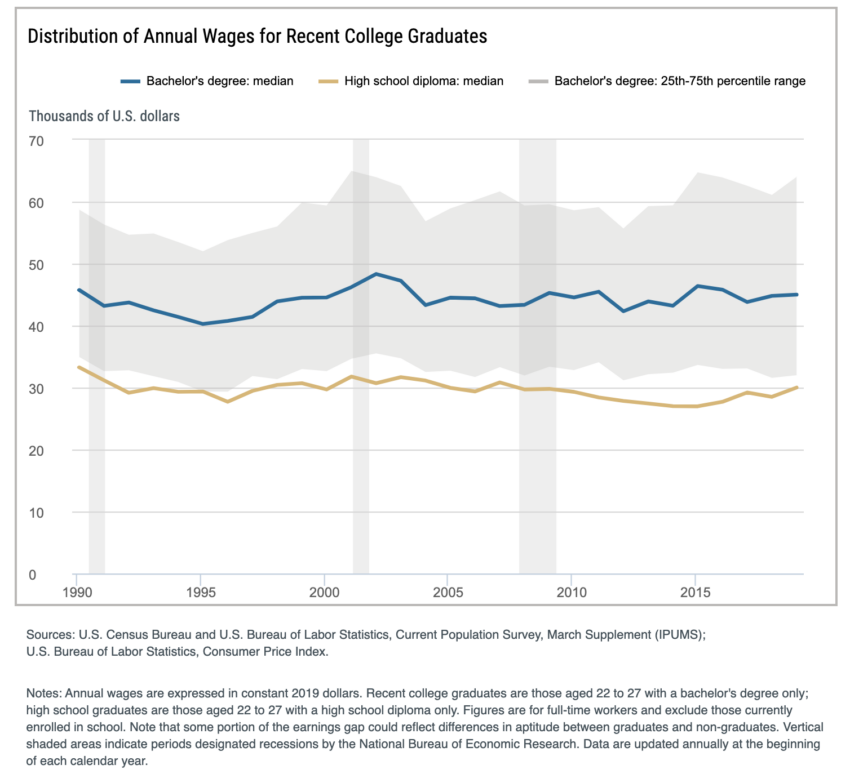
From the Fed. Overall, college continues to pay off*, even looking just at early career earnings:
Of course labor market outcomes differ by major, sorted here by median wage mid-career:
| Major | Unemployment Rate | Underemployment Rate | Median Wage Early Career | Median Wage Mid-Career | Share with Graduate Degree |
| Pharmacy | 3.7 | 28.7 | 40,000 | 115,000 | 58.8 |
| Computer Engineering | 2.5 | 20.1 | 65,000 | 106,000 | 39.9 |
| Chemical Engineering | 2.6 | 21.6 | 68,000 | 103,000 | 48.8 |
| Aerospace Engineering | 4.1 | 26.8 | 64,000 | 100,000 | 52.9 |
| Electrical Engineering | 4.6 | 22.3 | 65,000 | 100,000 | 44.8 |
| Mechanical Engineering | 4.3 | 21.0 | 63,000 | 98,000 | 41.0 |
| Computer Science | 4.7 | 23.5 | 62,000 | 95,000 | 32.3 |
| Physics | 5.3 | 31.7 | 48,500 | 94,000 | 68.9 |
| Civil Engineering | 1.9 | 17.5 | 60,000 | 90,000 | 37.7 |
| Economics | 4.1 | 39.8 | 55,000 | 90,000 | 42.2 |
| General Engineering | 5.0 | 23.5 | 60,000 | 88,000 | 36.2 |
| Business Analytics | 3.8 | 37.5 | 57,000 | 88,000 | 23.8 |
| Industrial Engineering | 3.4 | 17.3 | 64,000 | 87,000 | 39.7 |
| Miscellaneous Engineering | 4.3 | 29.4 | 60,000 | 85,000 | 44.1 |
| Construction Services | 6.1 | 34.0 | 56,000 | 85,000 | 10.4 |
| Finance | 3.5 | 37.0 | 52,000 | 85,000 | 30.5 |
| Mathematics | 5.8 | 30.6 | 50,000 | 80,000 | 52.2 |
| Engineering Technologies | 5.3 | 40.9 | 50,000 | 80,000 | 24.3 |
| Architecture | 4.3 | 26.6 | 45,000 | 75,000 | 37.4 |
| Information Systems and Management | 5.0 | 38.1 | 50,000 | 75,000 | 24.0 |
| Biochemistry | 3.1 | 33.5 | 40,000 | 75,000 | 70.8 |
| Miscellaneous Physical Sciences | 4.0 | 35.9 | 46,000 | 75,000 | 56.2 |
| Political Science | 4.2 | 51.5 | 42,000 | 75,000 | 51.7 |
| International Affairs | 4.7 | 49.7 | 45,000 | 75,000 | 42.6 |
| Chemistry | 3.9 | 35.4 | 41,000 | 74,000 | 65.0 |
| Marketing | 3.0 | 52.7 | 42,000 | 74,000 | 16.9 |
| Advertising and Public Relations | 3.7 | 47.7 | 40,000 | 72,000 | 18.3 |
| Accounting | 2.8 | 23.0 | 50,000 | 72,000 | 28.7 |
| Miscellaneous Technologies | 6.4 | 58.0 | 37,000 | 72,000 | 16.8 |
| Communications | 3.9 | 53.0 | 40,000 | 70,000 | 23.3 |
| Geography | 5.0 | 33.5 | 42,000 | 70,000 | 34.4 |
| Nursing | 2.0 | 11.4 | 50,000 | 70,000 | 26.4 |
| General Business | 3.7 | 56.4 | 45,000 | 70,000 | 23.8 |
| Overall | 3.9 | 42.9 | 40,000 | 68,000 | 37.5 |
| Treatment Therapy | 3.2 | 33.0 | 36,000 | 67,000 | 45.1 |
| History | 4.1 | 53.1 | 36,000 | 66,000 | 49.4 |
| Environmental Studies | 4.6 | 49.3 | 36,000 | 65,000 | 32.2 |
| Journalism | 3.7 | 42.5 | 38,000 | 65,000 | 25.3 |
| Biology | 4.6 | 44.6 | 35,000 | 65,000 | 63.2 |
| Earth Sciences | 5.3 | 43.1 | 40,000 | 65,000 | 46.1 |
| Business Management | 4.2 | 59.6 | 40,000 | 65,000 | 23.3 |
| Medical Technicians | 1.0 | 50.9 | 42,600 | 64,000 | 24.3 |
| Philosophy | 6.2 | 50.9 | 36,000 | 62,000 | 57.3 |
| Interdisciplinary Studies | 4.6 | 48.0 | 38,000 | 61,000 | 36.5 |
| Agriculture | 3.1 | 53.9 | 40,000 | 60,000 | 20.8 |
| Animal and Plant Sciences | 3.0 | 57.4 | 35,000 | 60,000 | 34.8 |
| Mass Media | 7.8 | 55.2 | 35,000 | 60,000 | 18.3 |
| Foreign Language | 4.2 | 46.2 | 35,000 | 60,000 | 50.0 |
| English Language | 5.3 | 50.6 | 35,000 | 60,000 | 45.5 |
| Liberal Arts | 6.7 | 58.4 | 33,400 | 60,000 | 27.8 |
| Miscellaneous Biological Sciences | 3.9 | 46.5 | 35,000 | 60,000 | 60.4 |
| Criminal Justice | 4.1 | 73.2 | 37,000 | 60,000 | 22.2 |
| Public Policy and Law | 1.7 | 62.8 | 40,000 | 60,000 | 44.8 |
| General Social Sciences | 4.6 | 52.3 | 36,000 | 60,000 | 37.9 |
| Art History | 3.8 | 56.5 | 38,900 | 60,000 | 41.2 |
| Commercial Art and Graphic Design | 4.9 | 36.2 | 40,000 | 60,000 | 10.9 |
| Leisure and Hospitality | 3.7 | 63.0 | 34,200 | 58,000 | 30.2 |
| Performing Arts | 3.7 | 65.7 | 30,000 | 58,000 | 37.6 |
| Ethnic Studies | 5.7 | 50.1 | 38,000 | 57,000 | 49.4 |
| Anthropology | 6.6 | 59.1 | 33,000 | 57,000 | 46.9 |
| Psychology | 4.1 | 49.7 | 34,000 | 56,000 | 50.3 |
| Sociology | 3.9 | 56.0 | 34,600 | 56,000 | 35.2 |
| Fine Arts | 5.6 | 58.4 | 33,500 | 55,000 | 22.5 |
| Health Services | 3.1 | 45.7 | 36,000 | 55,000 | 52.5 |
| Nutrition Sciences | 5.8 | 47.9 | 35,000 | 54,000 | 46.4 |
| Secondary Education | 2.3 | 23.5 | 38,000 | 50,000 | 48.4 |
| Family and Consumer Sciences | 4.3 | 44.6 | 32,000 | 50,000 | 32.5 |
| Theology and Religion | 1.0 | 46.9 | 32,000 | 49,000 | 42.2 |
| Miscellaneous Education | 1.2 | 17.5 | 37,000 | 48,000 | 55.3 |
| General Education | 1.7 | 22.2 | 36,000 | 45,000 | 47.4 |
| Special Education | 2.9 | 16.2 | 37,000 | 45,000 | 60.8 |
| Social Services | 3.5 | 31.5 | 31,300 | 44,200 | 47.4 |
| Elementary Education | 1.9 | 15.9 | 35,000 | 43,000 | 47.0 |
| Early Childhood Education | 1.7 | 19.2 | 32,100 | 41,000 | 38.2 |
* Your results may differ. No accounting for selection effects.
How does that data reconcile with the fact student loans are increasingly not being paid?
WSJ: 40% Of Student Loans Not Being Paid.
http://www.wsj.com/articles/more-than-40-of-student-borrowers-aren‘t-making-payments.
Forbes: The U.S. Student Loan Debt Crisis Is Even Worse Than We Thought
http://www.forbes.com/sites/zackfriedman/2019.
On the other hand, data from the same report tells us,”The unemployment rate for young college graduates exceeds that of the general population, and about 41 percent of recent college graduates — and 33.8 percent of all college graduates — are underemployed in that they are working in jobs that don’t require a college degree.” (from IHE: https://www.insidehighered.com/quicktakes/2020/02/18/41-recent-grads-work-jobs-not-requiring-degree)