I don’t know who is responsible, but UO’s IR department continues to post interesting data. Thank you! Their website at http://ir.uoregon.edu/ currently features some numbers relevant to President Schill’s realignment efforts, which the Senate will take up during its April 27th Town Hall meeting, 3PM in Straub. Check out their page, the extracts below show the changes in the composition of UO students by College and division from 2005 to the present. I’ve focused on undergraduates and on comparing CAS Humanities to UO as a whole and I’ve added Business at the bottom, since it provides the most dramatic contrast.
In a nutshell, relative to the rest of UO, undergrads in CAS Humanities are now far more likely to be in-state, Pell eligible (low income) and racially and ethnically diverse – if you’re into slicing and dicing students that way. Please let me know in the comments if you see other things in the IR data that deserve attention.
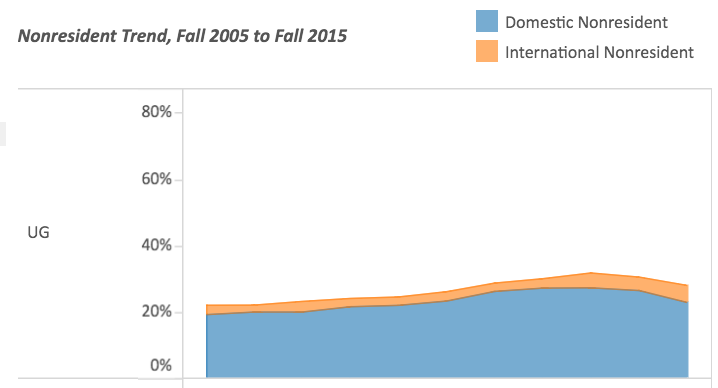
All UO undergrads: The percentage of in-state undergrads has dropped from about 75% to 55%. The percentage Pell eligible has been roughly constant, now at 24%:
Note the change in the color scheme below: Blue is now undergrads, Orange grad students.
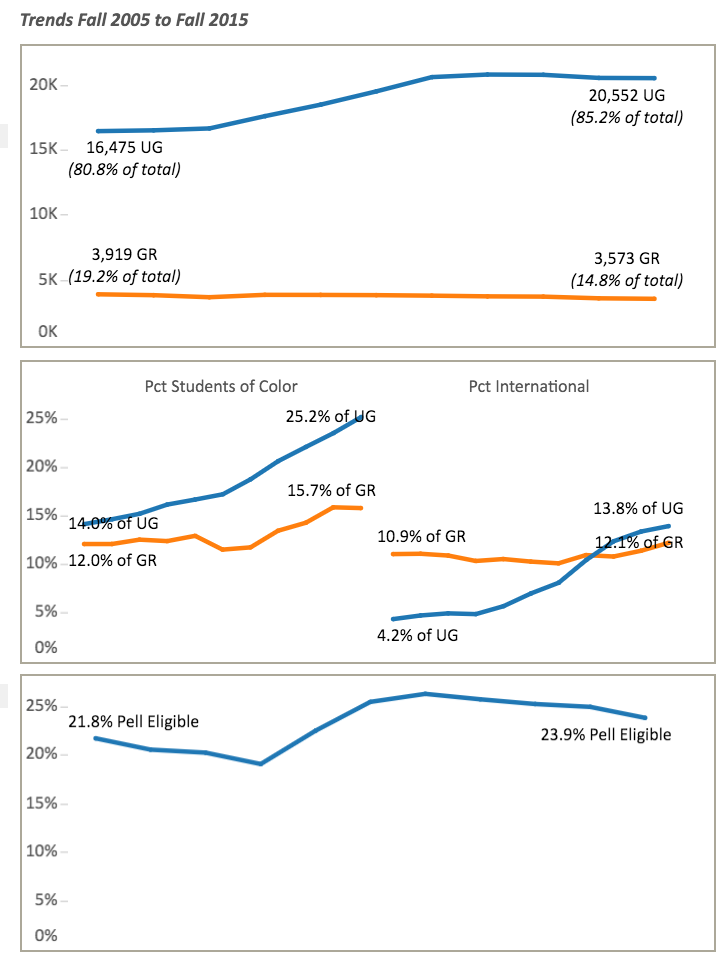
CAS Humanities: Overall enrollments are down, but the percentage of in-state students has held fairly constant now at about 75%, and the percent Pell eligible has increased to from 25% to 33%:
Note the change in the color scheme below: Blue is now undergrads, Orange grad students.
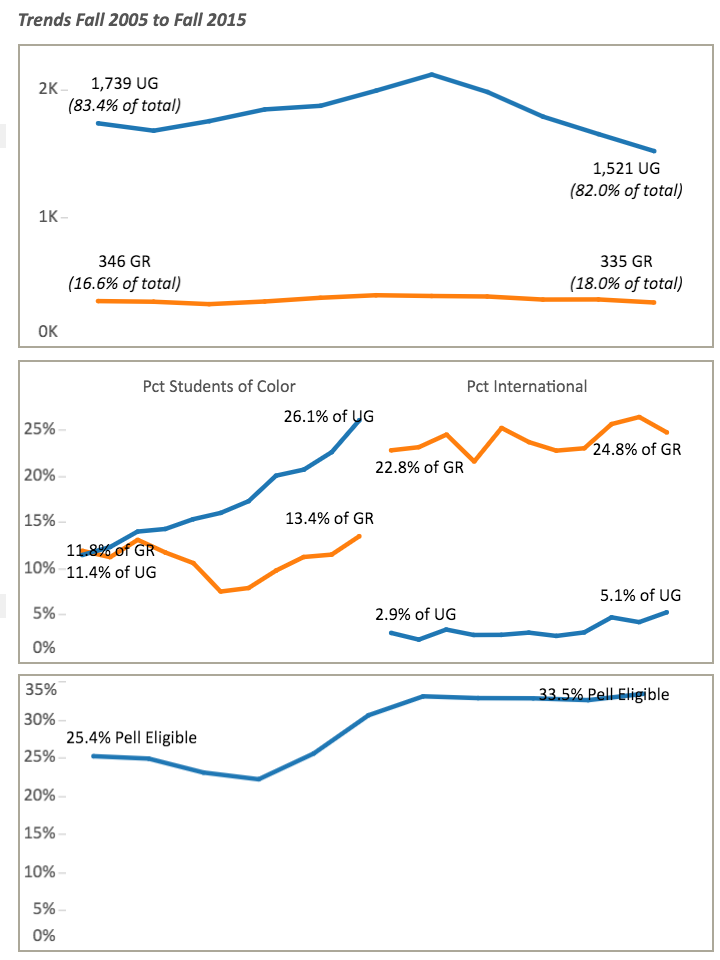
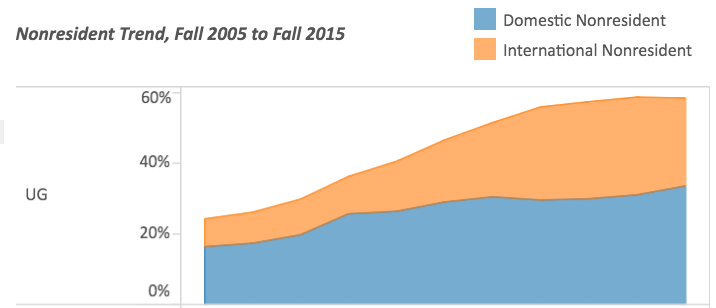
Business: Overall enrollments are up, the percentage of in-state students has fallen from 75% to 40%, and the percent Pell eligible has been mostly flat, now about 15%:
Note the change in the color scheme below: Blue is now undergrads, Orange grad students.

agreed completely
once IR got a decent front end (Tableau) they are providing really good data, without spin, just data.
The very first slide indeed shows that Graduate Enrollment has DROPPED (by 15%) from 2005 -2015. I have had many in CAS
tell me that this is not True!
Where’s the big boost we were supposed to get from all the money we’re spending on Duck sports? It looks like enrollment flat-lined right around when Chip Kelly started winning.
I’m concerned about the ratios. Are we using rich out of state students to susidize pell eligible students (good in my view).
Or are we admitting poor out of state students too who are pell eligible but can’t get into a UC? We take their pell dollars. We take their student loans. But we know they’ll probably flunk or quit after two years?
Two other things to notice about the top most graphic
1. Flux of out of state domestic students (probably mostly from CA) has been flat for about the last 4-5 years. Going to bowl games is therefore NOT attracting more out of state students.
2. Flux of international students abruptly rose starting in about Fall 2011 – I believe this was someone’s intentional decision to change the profile of the UO.
I think this was a common change at most public univ. I have friends at U Mich and Mich State. Good public universities. Not a lot of out of state students (they are considering taking more). A TON of international students. Its a huge supply and if you are willing to admit students with iffy (likely fraudulent) testing data, your universities gets a 30,000-40,000 a year influx.
I AGREE – if your willing to admit them – big downside to that in my opinion but that clearly doesn’t matter