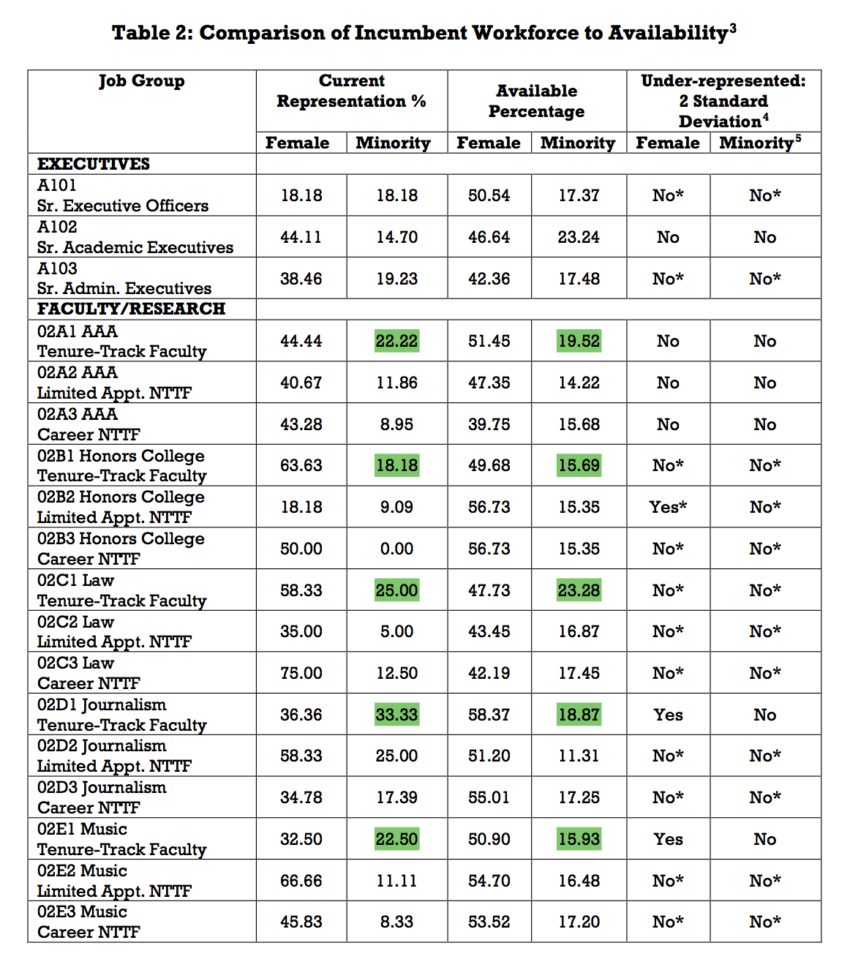
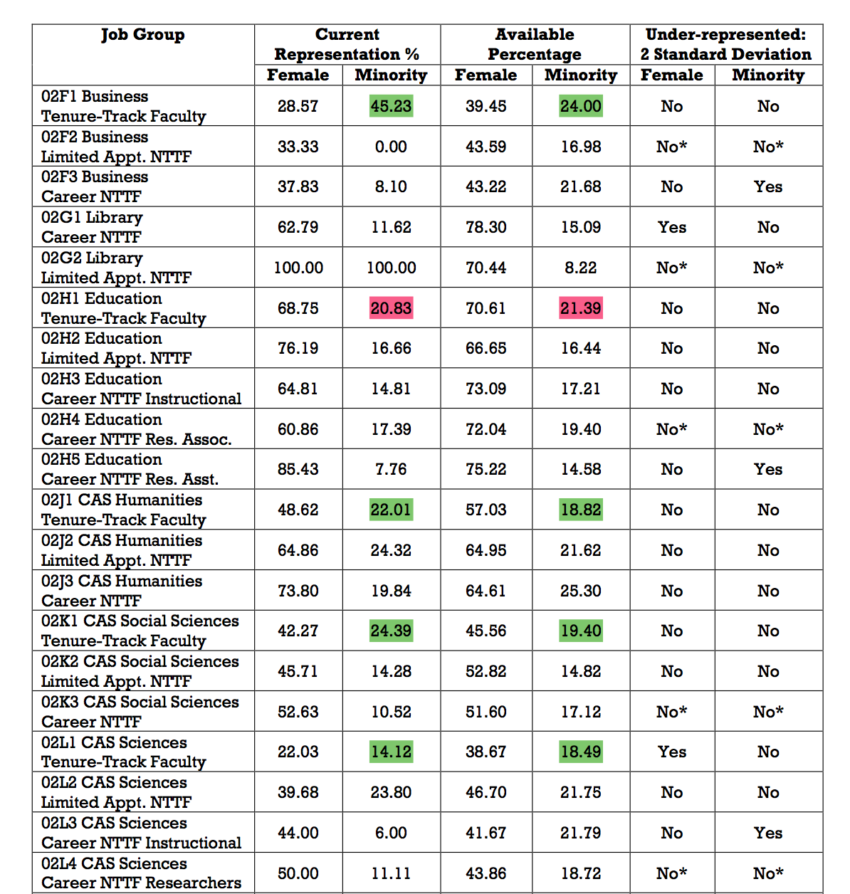
That’s the official word from UO’s Affirmative Action and Equal Opportunity office latest AA Plan here. Focusing only on minority tenure track faculty, UO in general has more minority faculty than the available pool of minority faculty, which AAEO defines here:
Because of the unique and highly competitive requirements for employment within a comprehensive research and teaching institution, the university utilizes additional sources of statistical information regarding the availability of qualified women and minorities. Most notably, because a Ph.D. or other terminal degree is required for most tenure-related positions, the university uses the National Center for Education Statistics (NCES) for information on the number of degrees granted by discipline to help determine the percentage of women and minorities with the requisite skills who are potentially qualified for instructional and research faculty positions. For tenure related job groups, the university uses terminal degree data.
UO’s AA Plan, Table 2. None of the minority differences are statistically significant according to the rather conservative Exact Binomial Test of Proportions that AAEO uses.
By the more liberal, and arguably more appropriate population measure, every college except our College of Education has more minority faculty than the pool – and even education is less than 1% below the available pool:


Comments welcome on NTTF, Administrators, and gender differences.
I have to say I am less than thrilled to see my presence being used to obscure the dearth of Black and Latino/a faculty.
How do you conclude this? Asian Americans are _not_ counted as under-represented in EO/AA statistics.
I conclude that from the AAEO report. In the table that UOMatters screenshotted you’ll see that there’s a superscript 5. If you go to the footnote in the actual report on page 35, footnote 5 states that that table uses “total minorities.”
However, the heading at the top of that column says “Under-represented” above the subheadings “women” and “minorities,” so I think that “under-represented” applies even to the footnote. Also, this has come up in discussions with HR for hiring committees I’ve been on, and what I wrote above has always been the case.
That may well be the case in some instances, but the referenced data here is from an AAEO document that refers to “minorities” not “under represented minorities”
See above.
UOM, can you share more about the first line of the table here where it seems to indicate that the available population of female senior admins is about 50% but we have 18% female representation? Who are or at least the number of) the administrators being counted here? And this is not a problem?
Also, what does “standard deviation” mean here? I thought it referred to an empirically derived estimate of variance. How do you get that from these sorts of frequency data? And who selected “2 standard deviations” as the cut-off?
Also are the “appropriate test of statistical significance” and the “standard deviation analysis” that they used?
From the report linked above:
“We have used appropriate tests of statistical significance, relying on the standard for measuring “reasonably expected” approved by the court in Firestone Tire & Rubber Co., Inc. v. Marshall, 507 F. Supp. 1330, 24 FEP 1699 (Eastern District of Texas, 1981, upholding the decision of the Administrative Law Judge) as well as many other federal courts.
“For job groups with more than 30 incumbents we have determined statistical probability using standard deviation analysis and have set a goal whenever the difference between availability and incumbency was 2.0 standard deviations or more.
“For job groups with 30 or fewer incumbents, we have determined statistical probability using Exact Binomial, setting a goal whenever probability is less than or equal to .05.”
And one more note: regarding compensation equity, the report provides neither methodology detail nor data, but makes the following sweeping claims:
“There are no gender-, race-, or ethnicity-based disparities in the practices or rates of pay for these positions.”
and
“A review of the elements of the university’s various compensation systems has not identified any disparities among similarly situated employees on account of gender, race, or ethnicity.”
How comforting.
If it helps, the AAEO Director who wrote this report is no longer employed by UO, and the search for a competent replacement is underway.
Even though I’m color blind I noticed you colored the CAS sciences TTF entries for represented and available green, but that should be red.
Whoops, thanks.