Last updated on 12/16/2017
8/7/2017: UO is failing on economic diversity. Where’s the “Economic Diversity Action Plan”?
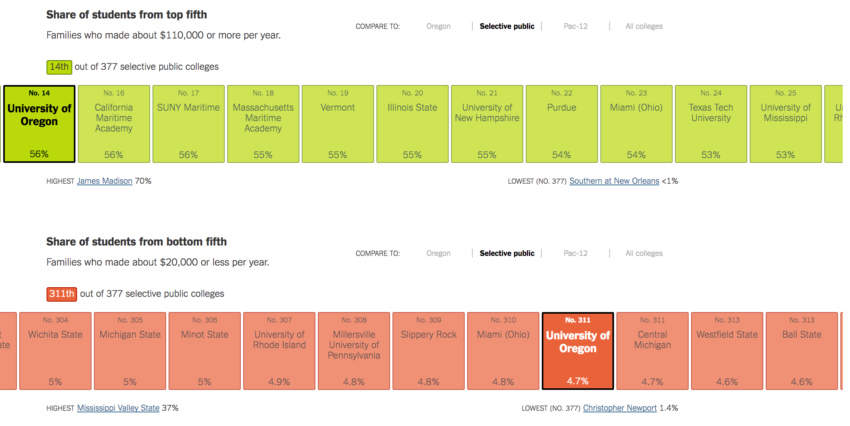
UO is ranked #328 out of 377 selective public colleges for promoting income mobility. 56% of our students come from families in the top 20% of the income distribution (4.3% from the top 1%) and only 4.7% come from the bottom 20%:
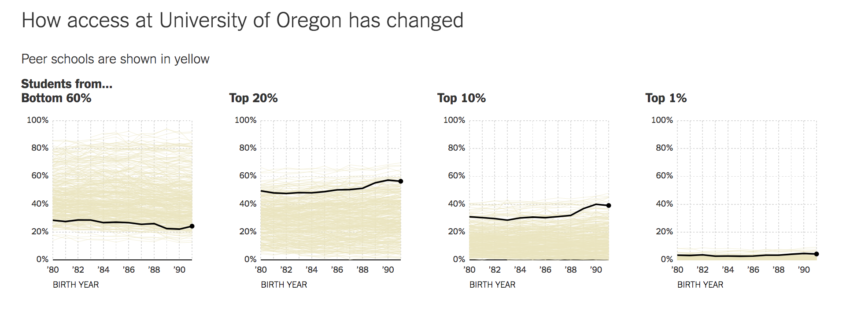
Our economic diversity has been getting worse over time (except perhaps for a small recent blip):
Despite this poor performance and the bad trends, UO’s long debates about diversity have generally ignored economic diversity. UO’s Institutional Research website has pages and pages of tables slicing and dicing UO’s students and faculty by every imaginable diversity metric – so long as those metrics are race and ethnicity or gender. The good news is that UO has improved markedly by all those measures over the past 10-15 years.
However, if you believe economic opportunity and diversity are important, you will have no luck finding that information on the IR website. If you go to UO’s Office of Equity and Inclusion’s “IDEAL Plan” you’ll find that the latest version now pays lip service to economic diversity, but you will not find a word about how UO compares on the relevant measures, or on the time trends. Similarly, the “Diversity Action Plans” that are now under preparation by every academic and administrative unit under the supervision of Equity and Inclusion have little if anything to say about economic diversity – it’s all race with a bit of gender.
Fortunately there is a new paper out with the data for UO and other colleges:
Mobility Report Cards: The Role of Colleges in Intergenerational Mobility
Raj Chetty, John Friedman, Emmanuel Saez, Nicholas Turner, and Danny Yagan
National Bureau of Economic Research Working Paper No. 23618, Revised Version, July 2017
Fact sheet: PDF
Non-technical summary: PDF
Paper: PDF
Slides: PDF | PPT
Data: Stata / Excel
NYT Interactive Tool to Explore Data: Web
Unfortunately that paper makes it very clear UO is failing when it comes to promoting economic diversity. The figures at the top of this post come from the NYT summary for UO:
A new study, based on millions of anonymous tax records, shows that some colleges are even more economically segregated than previously understood, while others are associated with income mobility.
Below, estimates of how University of Oregon compares with its peer schools in economic diversity and student outcomes.
The median family income of a student from University of Oregon is $126,400, and 56% come from the top 20 percent. About 1.4% of students at University of Oregon came from a poor family but became a rich adult.
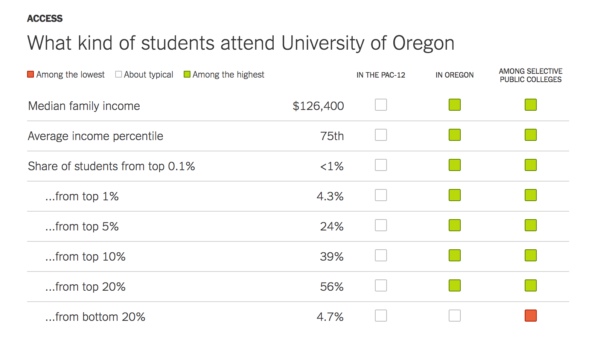

When it comes to economic diversity UO is near the bottom whether you look at selective publics, the PAC-12, or other Oregon universities:


It would be nice to believe that these sad results will help drive UO’s diversity debate and spending priorities for promoting diversity.
9/12 2017: From the RG, here: University of Oregon hangs onto spot at 103 in U.S. News & World Report rankings; OSU drops to 145
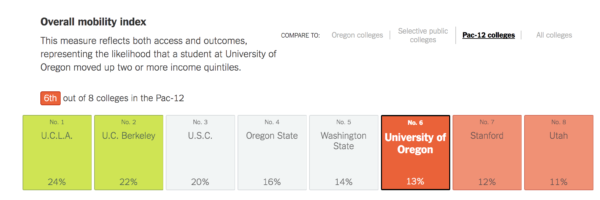
As explained below, colleges that are trying to pump up their U.S. News ranking have a strong incentive to cut back on enrollment of students from low-income families. The article blames this for part of the decline in intergenerational income mobility in the U.S. and the increase in inequality. (Although a similar pattern is apparent in, for example, Canada.) While the data is from 2013, and UO’s PathwaysOregon program has probably improved it, here is the comparison for UO and OUS (and other PAC-12 schools), on their impact on intergenerational income mobility:
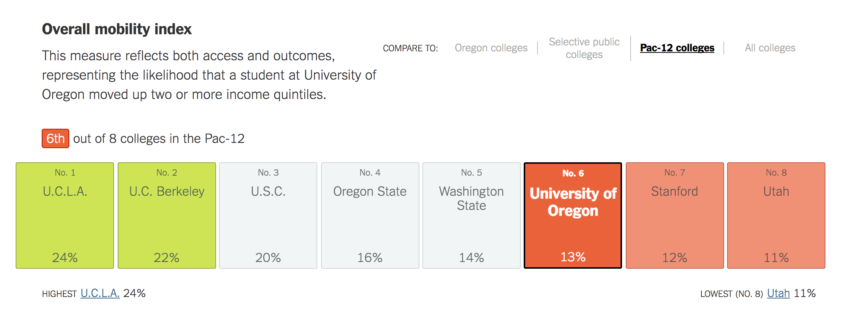
Put simply, UO does not enroll enough low-SES students, and while it does raise the income of those who graduate substantially, it’s still not enough. The problem of where to find the money to do it is made worse by the fact that doing it would hurt our US News rank, and drive away the out-of-state high-SES students who help pay for low SES Oregonians.
9/11/2017: From Politico, here: How chasing U.S. News college rankings hurts economic diversity
America’s universities are getting two report cards this year. The first, from the Equality of Opportunity Project, brought the shocking revelation that many top universities, including Princeton and Yale, admit more students from the top 1 percent of earners than the bottom 60 percent combined. The second, from U.S. News and World Report, is due on Tuesday — with Princeton and Yale among the contenders for the top spot in the annual rankings.
The two are related: A POLITICO review shows that the criteria used in the U.S. News rankings — a measure so closely followed in the academic world that some colleges have built them into strategic plans — create incentives for schools to favor wealthier students over less wealthy applicants. …
Read it all. While the repeated attempts to make a Trump connection are a bit overwrought, the Georgia State story is really depressing – serving the middle class has cost them 30 points in US News.
Even now, UO is clawing back money from the various units, to use for diversity programs. But I would bet it’s mainly to feed the obsession with race and ethnicity.
Socioeconomic diversity? But this would go disastrously against the UO financial model. What the hell does anyone think going for 50% out of state and charging sky high tuition is about? And what would UO do if it started taking in more lower income students. Imagine what a $50 million budget hit would do. Imagine all the outrage about salaries, research support, and so on ad nau.
Now, maybe the next billion in endowment could be devoted to tuition relief? Phil? Faculty?
Thanks for the excellent post. This is very important data. In the past the UO did far more with far less when it comes to helping poor kids. Now, it just isn’t a priority. At some point, people will recognize that the UO is serving itself rather than the vast majority of Oregonians.
What do you mean? UO set a goal of working on diversity in a couple of dimensions, and has met that goal. If the “vast majority of Oregonians” want the UO to focus on something different, they should be incentivizing UO to do so.
Very nice and thought-provoking. But consider that many of the programs that one can expect to drive mobility –professional degrees, engineer, med or nursing schools–are simply missing at the UO. The university should think about how to prioritize those programs in the future.
UO is way behind the curve in addressing the needs of underserved groups, including lower SES students. But the underrepresentation of these students says a lot more about the priorities of the state legislature and the Oregon electorate than it does about UO. Public institutions are supposed to serve the public, which means they need a solid public commitment. Some states–such as California–still understand this.
If we want to help people rise up economically, we need to focus on university educations that have will help translate into meaningful careers post graduation. Is that the hard sciences UO is typically seen as the strongest in? No. We need the translational science campus to become effectively an engineering school and play catch up the data science realm super quick.
Departments also need to let go of antiquated software tools they like (because they use them) and transition to things open source software because more and more employers are using it, and because they are easily accessible to students from disadvantaged backgrounds.
Your R pitch is noted. Free download here: https://www.r-project.org/
To repeat yet again, the UO charges the lowest net tuition to low income students of any college in oregon.
Oldtimer, is that for all low income students or only the low income students in a particular program? What is the yield on these low income students with the lowest net tuition? If we blew the doors open to any Oregon high school student who qualified for admission and were low income could we/do we take them all or do you need something extra special to qualify for this lowest net income? Oh and finally what do you mean by the lowest net tuition? I think that at many/most/all? schools one could contrive a definition of net tuition and low income that would equal $0 using federal and state grants and school based grant or remission.
Comparison is average for all low income students net means list tuition minus other support, as suggested as calculated similarly for all oregon public colleges oregons low income students deserve better, but posts above explain the quandary the free comm college program did not do any better either
note for future: https://olis.leg.state.or.us/liz/2017R1/Downloads/MeasureDocument/HB2864/Enrolled