2/20/2012: The figure and email below are from an anonymous correspondent. At UO there is a tiny correlation between a department’s average pay relative to their discipline and their research productivity relative to their discipline. You’d expect better ranking departments would be closer to AAU comparator pay. Nope, mostly it’s random noise.
Half of UO department’s are above average w.r.s.t. research according to the NRC. We are all behind on pay. Boost pay by 3% or so to account for the Lariviere raises and an adjustment for raises at our comparators. We are still way behind.
Thanks for this interesting post, anonymous! I’m guessing you’re no computer science professor. Comparative literature?
Email:
There has been some discussion on your blog and elsewhere about market-based salary differences between fields (e.g., economists make more money than musicians), and whether a union would or would not try to flatten those differences. That got me wondering about a separate issue. Over and above those market differences, I wondered if there already are — and if there would be under a union — merit-based differences between departments. In particular, if your department is at the top (or bottom) of its respective field, is that reflected in the department’s salaries?
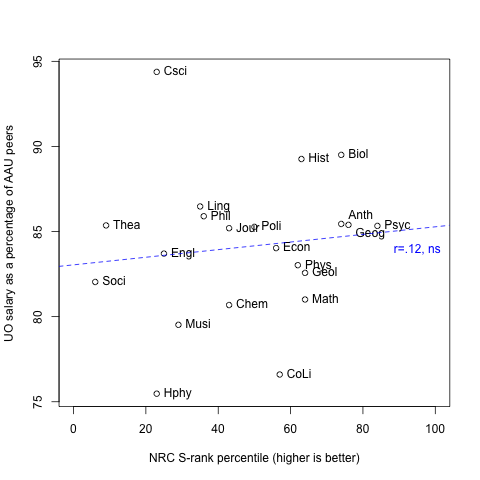
To look into that question, I started with the list of NRC percentiles by department that you calculated for the blog post. Against that I plotted each department’s average UO salary as a percentage of its AAU comparators (to account for the market differences between disciplines). I used the “all ranks weighted” values which should adjust for departments that are tilted toward more junior or senior faculty. (Data from here: http://ir.uoregon.edu/sites/ir/files/UO with OUS Peers by Dept_2011.pdf).
The answer seems to be that there is almost no correlation (r=.12) between NRC rank and a department’s salary differential relative to its comparators. The scatterplot is [above]. (Minor note: I reversed the percentiles you posted so that higher means better.)
One conclusion you could draw is that, at a departmental level, it makes a big difference what discipline you are in, but almost no difference in whether you are good or bad in your discipline. I wonder why there isn’t more of a relationship, and whether that would change for better or worse under a union contract.
Or maybe there are obvious problems with this analysis that I’m not seeing?
dog barks and chokes
why would you expect any correlation between
a Graduate Research Rating and a department average salary?
Some high salary departments (like Computer Science)
won’t even have much of a grad program, for instance.
Anonymous correspondent here. This is not a comparison with department average salary. The numbers on the y-axis are relative to department-specific comparators. So to highlight UO Matters’s examples: Computer Science is making 94% relative to AAU-comparator CS departments, and Comp Lit is making 77% relative to AAU-comparator Comp Lit departments.
As for the x-axis, yes, NRC rankings are nominally about PhD programs. But if you look at how the rankings were calculated, they are weighted heavily on faculty grants, publications, and awards. Which is why UO Matters and many others have interpreted them as a rough-but-useful indicator of research productivity.
I don’t know what the correlation should be, but I was a little surprised it was almost zero. Let me ask Dog (or anyone else): what SHOULD explain the differences in relative compensation?
Dog replies.
I would have expected it to have no correlation – differences in relative compensation mostly have to do with external market. A computer science, business, or economics professor can make a lot more in the real world than they can in the academic one.
Faculty in the humanities have less opportunity so the market allows them to accept
lower salaries (I am not saying this is right or wrong.
The only way there would be a correlation is if your university specifically made merit raises contingent upon the number of PHDs that you produce. While that ought to be part of your merit portfolio, it should only be a small part.
Conceptually, if it were the case that the highest paid departments were the ones with
the largest research output – then that’s a corporation; not a University. A university’s net worth is its integrated scholarship contribution to the world – no one individual or
department is above that standard.
So while the chemistry department, on paper, might have more research productivity than the english department, neither department is more important in the context of scholarship.
Its then only external market conditions that define a salary differential between chemistry and english.
There is also one more important item; different departments have much different mixes of
Full, Assoc, Assis and that makes a big difference (+/- 10K) on the department average
salary
Dog, anonymous correspondent here. I feel like I am starting to repeat myself, but as already noted, most of the things you mention are accounted for in the analysis:
“Differences in relative compensation mostly have to do with external market. A computer science, business, or economics professor can make a lot more in the real world than they can in the academic one. Faculty in the humanities have less opportunity so the market allows them to accept lower salaries.” As noted twice already, market differences were factored out of the analysis. See remarks above re: the denominator of the salary comparison. Or are you arguing that the external market values UO economists etc. differently than it values other AAU economists?
“The only way there would be a correlation is if your university specifically made merit raises contingent upon the number of PHDs that you produce.” NRC rankings are largely based on scholarly output (publications, grants, awards). They have almost nothing to do with number of PhDs produced.
“Conceptually, if it were the case that the highest paid departments were the ones with
the largest research output – then that’s a corporation; not a University. A university’s net worth is its integrated scholarship contribution to the world…” By using NRC percentiles, UO’s chemistry department’s research productivity is judged by the standards and norms of chemistry departments, and UO English by the standards and norms of English departments. So there is no apples-to-oranges comparison of, say, whether English is procuring as much grant money as Chemistry, or whether Chemistry is writing as many books as English.
“There is also one more important item; different departments have much different mixes of
Full, Assoc, Assis and that makes a big difference (+/- 10K) on the department average
salary” That is why the analysis used the rank-weighted-average salaries which adjust for differences in the mix of seniority of different departments.
Could the dog still be missing the point? The data points atop the y-axis are not the “highest paid departments” but the highest relative to their peers. The “external market forces” argument doesn’t seem relevant in that light.
I think the Dog got it right. Departments with high fluidity (faculty can easily move to industry or other schools) need to maintain pay close to what other universities pay. Departments without fluidity can impose lower salaries here and not worry about what their peers pay.
History has high fluidity but Chemistry doesn’t? Of course maybe it’s all just noise.
Yes dogs frequently miss academic points, because, afterall they are dogs.
But to respond a little bit more
1. Yes on the noise issue – in other words i expect +/- 5 percent deviations around
the line are just noise.
2. The Y-axis is a differential and not a direct measurement.
3. The more meaningful plot would be if you plotted average UO CAS department
salaries as a function of NRC index – that would directly address the issue of the relation
(or complete lack thereof) between average departmental salary and research productivity
at the UO. For instance, I am sure the average salary of the CIS department is significantly larger than chemistry which is larger than history.
My understanding of Russ Tomlin’s procedure for determining the Larviere round of faculty raises was to make increases based on department and rank, but not department or individual productivity.
The plan was to make a second round of merit raises, which presumably would increase the intercept and slope of the regression line above.
Then the faculty raises got mixed in with the administrative raises, the news broke, the raises for top administrators were indefensible, Pernsteiner used it as an excuse to fire Lariviere, so no second round.
Dog confirms
Here is a numerical example (not a real one) for the exact algorithm that was
used in the case of CAS – I believe the other schools were handled slight differently.
Dept Rank Average Salary Comparator Average Raise%
Juggling Full Prof 50,000 65,000 (30% more) =1/3(30%)
so all full professors in the dept of juggling would then get a raise of 10%
in many cases, the departmental average for Assistant Professors was not less
than the comparators and in those cases, no raises were given.
Compsci revolves a lot of people, as it almost always pays worse than elsewhere. Retention is a big part of the salary figure.