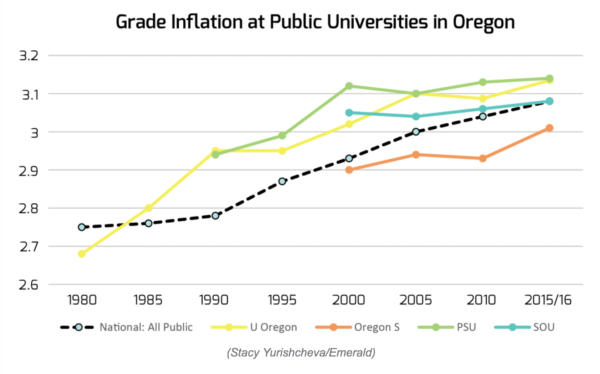
Will Campbell has an excellent data driven story with the history of UO’s failed efforts to fight grade inflation in the Emerald here:
… In 2009, when [CAS Associate Dean Ian McNeely] became chair of the Undergraduate Council, the university-wide body that oversees undergraduate education, he became familiar with grade inflation.
He decided to look into the grading culture at UO. He talked to at least five committees around campus, met with deans and the UO president, held town hall meetings and eventually published a blog in May 2010 to create a wider conversation for UO faculty about grading trends.
McNeely used a UO report from 2006 of the university’s grade statistics as evidence for grade inflation. The report found that between 1992 and 2004, the percentage of A’s awarded went up by about 10 percentage points — 31.3 percent to 41.6 percent— and the percentage of A’s and B’s together went up by seven points — from 65.6 percent to 72.6 percent.
McNeely published a report the next month with three proposals to take action against inflation. The report states that McNeely proposed each department develop specific grading standards, or “collaborate and decide on their own general description on an A, B, C grade, and so on,” he said.
He and the undergraduate council also wanted each department to evaluate the grading habits of its professors. That way department leaders would be able to safeguard against inflation. McNeely’s third proposal suggested that students’ transcripts show what percentage of the class received the same grade. “So that would almost be an incentive for professors not to inflate grades because then it might look bad on a student’s transcript,” he said.
The first proposal passed in the senate, but McNeely said that not every department complied. The other two proposals failed on the senate floor.
Currently, McNeely is unaware of any administrative initiatives to combat grade inflation, he wrote in an email to the Emerald. …
There’s much more, read it all.

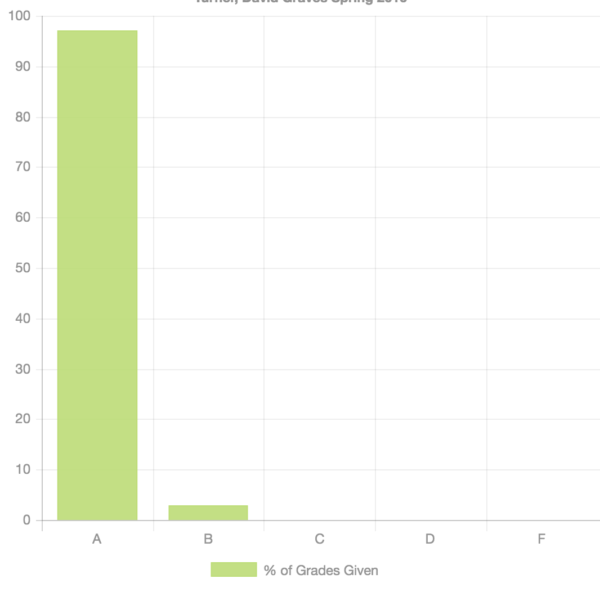
The Emerald also has an interface that lets you look at grades by course and instructor here. For example, here’s one of the infamous AAD 250 Gen Ed classes that VP for Academic Affairs Doug Blandy set up:

Long story short
Around 2004 or so I prepared a document on Grading Inflation for the Undergrad council. I did recommend that for large classes, those that actually produce a bell curve of scores, that the UO adopt what the UW did a long time ago and grade numerically (in units of standard deviation from those courses). I suggested mapping the average onto a 2.7 (of course it could map onto anything).
evidence suggests that this quantitative grading scheme has stalled grade inflation at the UW after
it was implemented in the mid 1970s.
http://depts.washington.edu/assessmt/pdfs/reports/95N3/OEAReport95N3.pdf
At the UO – kind of echoing McNelly – there is too much wide spread opinion on whether grade inflation is an issue here, so we just ignore it.
A simple rule might be that no more than 1 student in any class can earn an A+.
Whatever, nothing is gonna happen anyway …
Informative graph at
http://scienceblogs.com/principles/2014/02/03/the-evergreen-topic-of-grade-inflation/
and this is Mr. Grade Inflation (actually a silent co-author of the 2004 proposal)
http://stuartr.com/grade-inflation/
Thanks for posting this graph. I think the most interesting thing is that the percentage of students getting Fs has been stable at least as far back as 1940. This would seem to suggest that grade inflation isn’t resulting in lowered standards in any meaningful way; it’s just pushing the distribution of passing grades to the right. If this is aesthetically bothersome, or if it means it’s now impossible to differentiate exceptional work from good work, then just recalibrate by adding more headroom by using a 5-point scale instead of a 4-point scale.
I don’t know if others have tried this, but I can not verify the returned percentages for my real grade distributions in some of the courses. For instance, in one course I can look up that I gave 25% A’s but
the graph for that course shows 55%
so I don’t know
I’ve looked at several for me and for several of my colleagues and they are not at all accurate. Some are VERY inaccurate indicating that there were less than 5% A’s when I know there were closer to 15%.
thanks for confirming this; Emerald people reading this – you better check your script/code.
Wondering why this isn’t taken up by our Senate?
May I offer what may be a slightly different perspective on UO’s ‘grading culture’?
When I retired to Eugene after 30+ years teaching at a major UC campus, colleagues in the corresponding UO department found themselves shorthanded and asked me to teach one of their large GE courses. Being a fundamentally lazy sort, I offered essentially the same course I had regularly taught at UC: same syllabus, same lectures, same assignments, same tests. The difference was the students, who consistently scored 10-15% lower than my California students on every assignment. Final course grades came to roughly 8% As, 50% Bs, the rest scattered below, the high number of Bs probably the gift of my GTFs, who were responsible for most of the grading and were sweet kids more closely aligned with the undergraduates than with me.
But here’s the thing: my course evaluations were among the highest of my career! Students praised my knowledge, my passion, and my dedication. They enjoyed the lectures (class attendance was always pretty good) and admired the seriousness of the enterprise. No, they didn’t actually do what I asked, but they seemed to appreciate the idea of it all and accepted the grades received as, in effect, a fair cop. Some even said they admired a professor who gave the grades they had actually earned.
I don’t know if there’s a moral to this, but surely a little introspection by faculty about what the grading process means to accomplish might be a good idea.
Increasing average grades is not, in itself evidence of “grade inflation” anymore than increasing nominal GDP is evidence of price inflation.
What we have is statistical evidence of grade creep. Assessing how much of that is “grade inflation” requires some other metric of what grades are supposed to represent. Since we can’t even agree on what that is, worrying about “grade inflation” based on evidence this poor looks like pseudoscientific apocalypticism.
We should expect most academic institutions to have higher average grades over time *unless* grading schemes become more difficult. Four reasons
a. “intelligence inflation”. IQ has increased by about 3 points a decade which comes out to half a standard deviation per generation–which is at least one grade point on most curves
b. improved teaching: as instructors, every time we teach a class we get better. Grades and test scores provide us a metric by which to improve that teaching and teaching improvements can be transmitted to other instructors both socially and in terms of teaching materials
c. improved access to resources. Our students have smartphones which combine a super computer which the worlds largest library, in their pockets. It is obviously much easier for students to research a subject now than it has been in the past. Moreover, technological aids like spelling and grammar checks significantly ease core academic tasks
d. increased selectivity. The population of the US has doubled since 1955. Moreover, the percentage of students attending colleges has increased dramatically and we now recruit ever larger numbers of foreign students. University student body sizes at elite and mid tier schools have been relatively stable for decades. All of this means that a university at about the same relative ranking compared to other universities will have a much more elite student body now than it has in the past.
I’ve tried and failed to find any compelling evidence, statistical or otherwise, that the above factors fail to explain most, if not all, of the rise in grades overtime. I would expect people who profess to be committed to standards of academic evidence to avoid bandying about claims of “grade inflation” that are so poorly supported.
I doubt very much that any of these four reasons are accurate for the UO (I actually laughed at the thought of our students in the context of “intelligence inflation”), but I’m sure we all would be happy to see some of that “evidence” that Meta talks about…
I am quite sure that most think they know the reasons for grade inflation but are unable to provide evidence for it.
This is the only thing I think I know: somewhere along the evolution of college grading from the early 60’s to the mid 70s, the average grade for a course rose from a C which I think was to avoid the statistical failing of students if indeed a C is a hard average.
I largely agree with this sentiment and when I started teaching college courses in 1978 (yes you don’t have to believe this) I then and still do, map the average grade to a B-.
So in my own case the percentage of A’s given has not gone up (usually restricted to top 10-15% of class – but I have taught classes where no one has gotten an A, yes some have gotten A-) but the percentage of C’s has gone down. Basically in my case, for a student to get a C they have to perform 1.5 standard deviations below the average (in the past those students would have failed if the average was a C). So yes, this scheme contributes to grade inflation, but I am fine with that.
In addition, my experience shows an increase in P/F option for grading – not sure how that factors in – I think there is a UO policy on how many P/F credits are allowed, but its probably too generous. I also think
a P counts for a grade of 2.5, but I am not sure about
that.
It is good to be skeptical. However, while you may not be aware of secular rises in measured intelligence, that is an extremely robust effect and one comparable in size to supposed “grade inflation”
https://www.ncbi.nlm.nih.gov/pmc/articles/PMC4152423/
The average person today has an IQ more than a standard deviation higher than in the 1950s. It seems improbable that such a large change population level would skip the UO. So, dramatic increases in average grades over those time scales are expected if grades are determined by intelligence and that scaling is consistent.
Am skeptical about the supposed rise in intelligence.
SAT scores certainly haven’t risen (when you take out effects of various “renormings.”) In fact, verbal SAT scores took a big drop in the 1960’s from which they never really recovered.
The idea that intelligence has risen by a standard deviation since the 1950’s seems fairly ridiculous to me.
http://www.slate.com/articles/life/do_the_math/2002/10/dont_worry_about_grade_inflation.html
Cone on, my readers are lazy and so am I. Give us the elevator version at least!
It’s a quantitative argument against working oneself up about grade inflation. The author is Jordan Ellenberg, a professor at the University of Wisconsin who is highly regarded both as a mathematician and as a writer. Here is the final paragraph:
“In a healthy university,” Mansfield says, “it would not be necessary to say what is wrong with grade inflation.” There, again, he’s mistaken. In a healthy university, we would talk about every aspect of grading, down to the bottommost questions about why we grade at all. I suspect we’d all find it much less tempting, under those circumstances, to project onto our students’ GPAs our anxieties about moral leadership, honesty, and the rewards to be expected from hard work. That would be an improvement. Grades are—should be—many things. But ritual fetish objects they are not.