Updated below with info from Marie Vitulli (Math Emerita).
The 2015-16 AAUP salary survey is now out, and I’ve posted it below after the 2014-15 IPEDS data from the Chronicle. These data are self-reported by universities to the DoE or the AAUP, and not always accurately or consistently across universities. The definitions also vary across the two surveys, as do the comparison groups they provide.
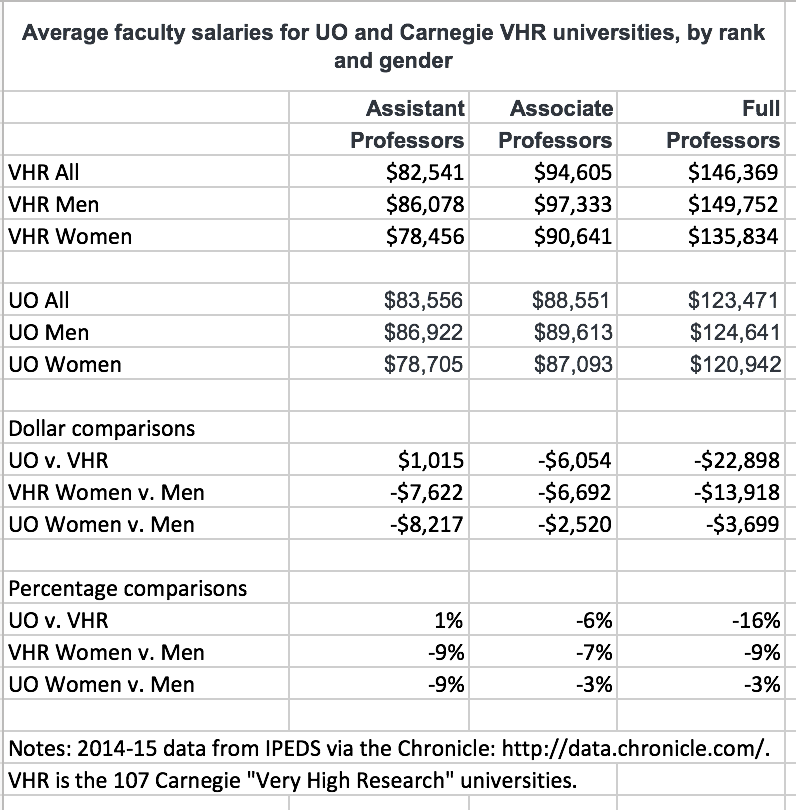
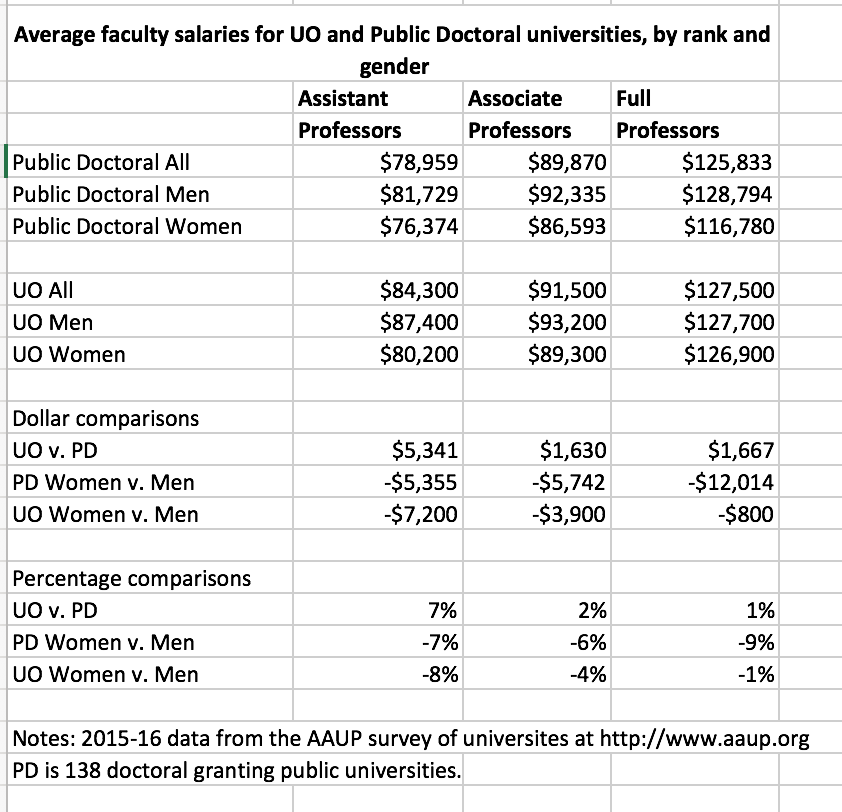
I was surprised to see that the gender gap at UO shrinks with faculty rank both in dollars and percentages, and almost disappears in the AAUP data. In contrast, for both sets of comparison universities the gap is pretty constant in percentages.
I wondered how much the gender gap varies across departments. For UO, you can get average pay by department and rank (but not gender) for 2014-15 from Institutional Research here. Or you can really drill down in the individual salaries – Feb 2016 is here. (When I looked for my department, I found some large errors in the IR summary data.) IR has also posted a “Faculty Equity & Inclusion Report” here, but it does not have any salary data. How odd.
For 2014-15, from the Chronicle (IPEDS):
For 2015-16, from the AAUP:
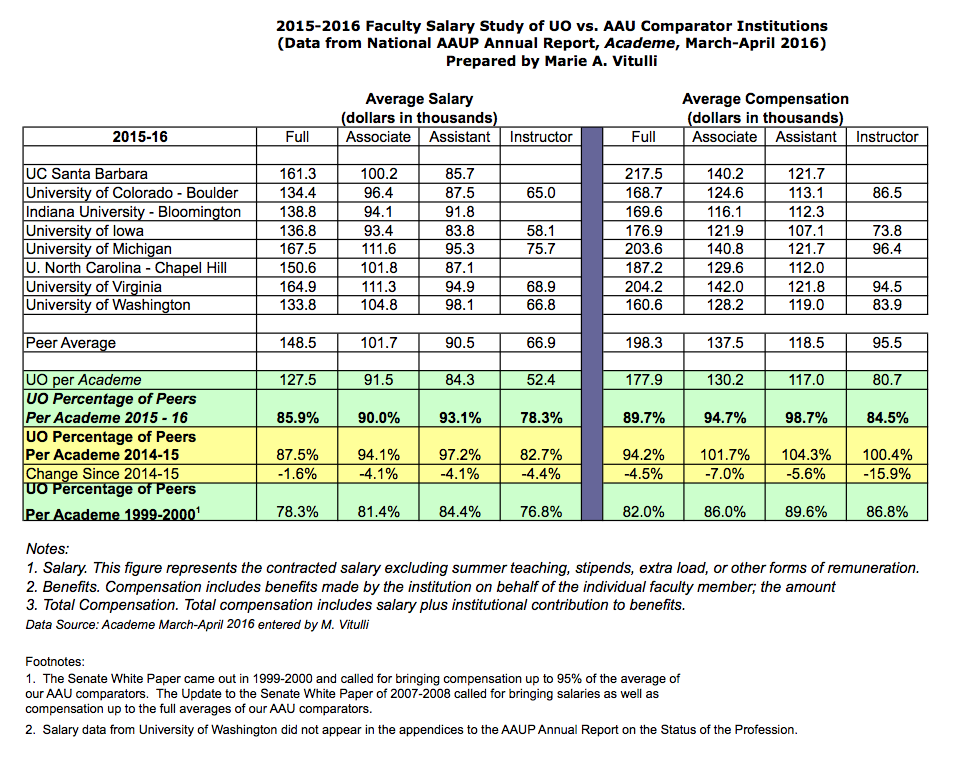
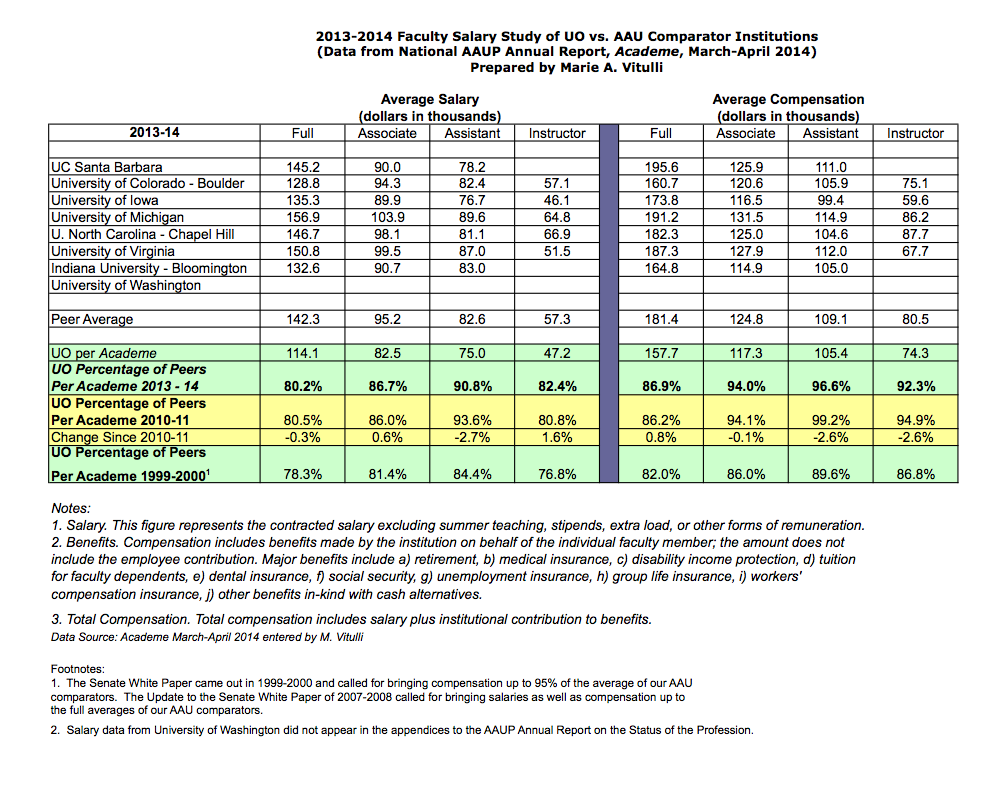
UO’s AAUP numbers are basically unchanged from last year, because during bargaining the administration insisted on delaying the raises until after the survey due date. Marie Vitulli (Math Emerita) has sent in this, comparing UO to our 8 AAU comparators. There is more on her website here.
By gender:
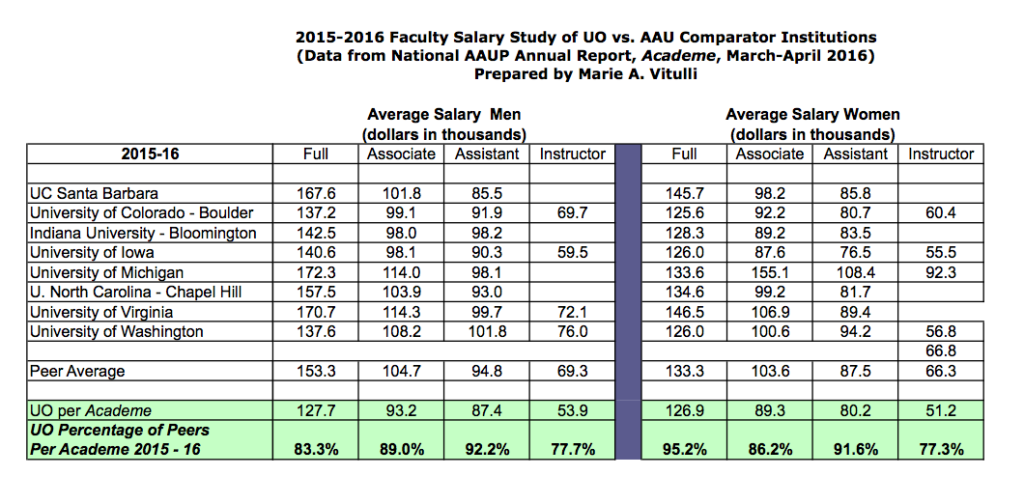
Overall, we’re dead last in pay, except we edge out Iowa for assistants. Because they know Uncle Bernie will ask, the AAUP also reports total compensation numbers, i.e. pay plus benefits. The ratio of benefits to salary for UO is higher than average, although the AAUP is careful to point out that total compensation measures the cost of benefits to the institution, not the value of the benefits to the faculty. I’m not getting a lot of benefit from Mike Bellotti’s $500K PERS deal, but it’s sure costing UO and other state employers a lot. For health insurance, UO pays the same rate as all state employers, even though UO workers are healthier than average.
And for a comparison, overall in 2013-14:
I don’t know why the salary numbers UO reports to the feds are so different from the numbers they report to the AAUP. Note that the AAU also uses a very different comparison group: public universities that grant a certain numbers of doctoral degrees. PSU, for example, is in the AAUP comparator group but not the Chronicle one. (The data on instructor/lecturer/NTTF/contingent pay is not very comprehensive, so I’ve omitted it.)
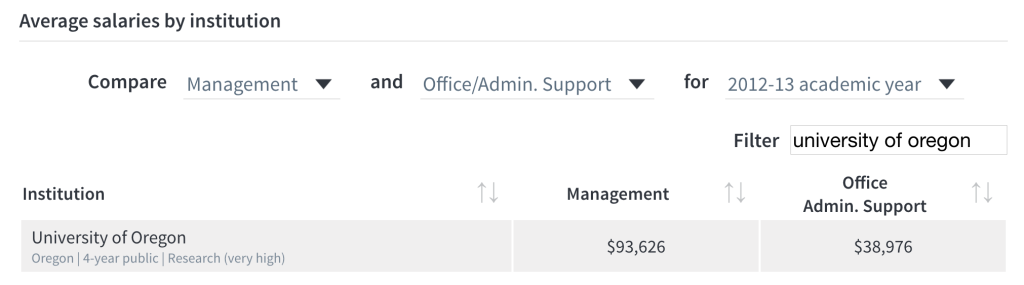
For non-academic employees, the Chronicle reports that average UO pay for those classified as Management for 2014-15 was $124,406 vs. $114,465 for all VHR universities. UO pay for Office/admin support was $41,417 vs. the VHR average of $44,090. I don’t think these cross-university comparisons are very reliable because of differences n the definitions, but the time trends for UO should be, and the pay increases for Management at UO have been remarkable:
2012-13:
2013-14:

2014-15:

Faculty pay by rank, gender time-trends 2004-2014 (2014 means the 2014-15 AY):